Crime Spotlight: Lampasas Texas, in Lampasas County
Having compiled 2019 data from the FBI and Texas Department of Public Safety, this report is intended to give an overview of crime as well as a comparison to TX DPS License to Carry issued in the affected zip codes. 2019 data is the most recent data released by the FBI - they generally release crime reports after 2 years.
Covered Zip codes:
76550
LTC issued for these zip codes will be covered in more detail below the crime statistics.
Crime in Lampasas Texas (FBI 2019)
| Percentage | Crime Category | Per Capita | Rank |
|---|---|---|---|
| 3.4% | Violent crime (15) | 186 | 295 of 533 |
| 0.0% | Murder and nonnegligent manslaughter (0) | 333 of 533 | |
| 0.7% | Rape (3) | 37 | 227 of 533 |
| 0.2% | Robbery (1) | 12 | 309 of 533 |
| 2.5% | Aggravated assault (11) | 136 | 257 of 533 |
| 46.5% | Property crime (206) | 2 | 418 of 533 |
| 4.5% | Burglary (20) | 248 | 220 of 533 |
| 40.6% | Larceny-theft (180) | 2 | 451 of 533 |
| 1.4% | Motor vehicle theft (6) | 74 | 357 of 533 |
| 0.2% | Arson (1) | 12 | 107 of 533 |
Your biggest issue living in or visiting Lampasas is property crime
Based on the FBI statistics, the most common crime in Lampasas is property crime per-capita. Lampasas ranks 418th in the state for property crime.
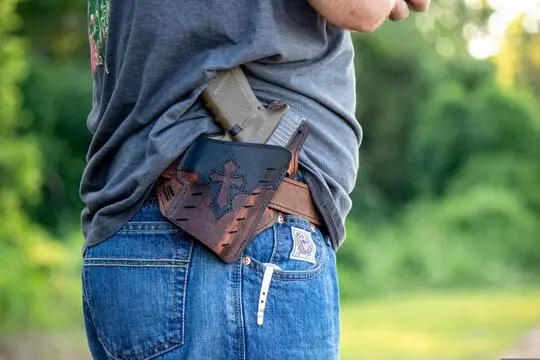
License to Carry in Lampasas Texas issued in 2019
Data obtained from 2019 demographics reports issued by Texas Department of Public Safety.
243 License to Carry in 76550