Spotlight: San Angelo Texas, in Tom Green County
Having compiled 2019 data from the FBI and Texas Department of Public Safety, this report is intended to give an overview of crime as well as a comparison to TX DPS License to Carry issued in the affected zip codes. 2019 data is the most recent data released by the FBI - they generally release crime reports after 2 years.
Covered Zip codes:
76901-76906, 76909
LTC issued for these zip codes will be covered in more detail below the crime statistics.
Crime in San Angelo Texas (FBI 2019)
| Percentage | Crime Category | Per Capita | Rank |
|---|---|---|---|
| 24.4% | Violent crime (357) | 353 | 157 of 533 |
| 0.3% | Murder and nonnegligent manslaughter (5) | 5 | 93 of 533 |
| 3.8% | Rape (56) | 55 | 171 of 533 |
| 2.2% | Robbery (32) | 32 | 212 of 533 |
| 18.1% | Aggravated assault (264) | 261 | 394 of 533 |
| 0.2% | Property crime (3) | 3 | 462 of 533 |
| 35.0% | Burglary (512) | 507 | 408 of 533 |
| 0.1% | Larceny-theft (2) | 2 | 466 of 533 |
| 15.3% | Motor vehicle theft (224) | 222 | 118 of 533 |
| 0.5% | Arson (7) | 7 | 148 of 533 |
Your biggest issue living in or visiting San Angelo is burglary
Based on the FBI statistics, the most common crime in San Angelo is burglary per-capita. San Angelo ranks 408th in the state for burglary.
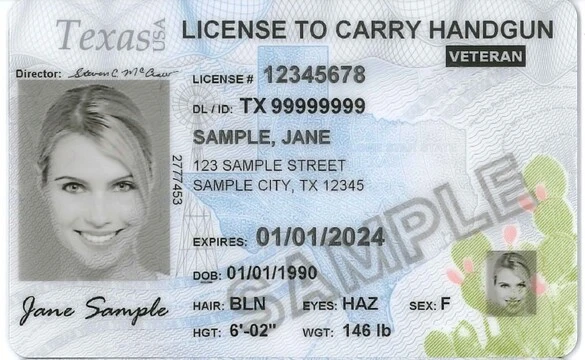
License to Carry in San Angelo Texas issued in 2019
Data obtained from 2019 demographics reports issued by Texas Department of Public Safety.
380 License to Carry in 76901
2 License to Carry in 76902
250 License to Carry in 76903
623 License to Carry in 76904
167 License to Carry in 76905
1 License to Carry in 76906
2 License to Carry in 76909